2025-07-18 Squarefoot Editor
- Home
- News
- Property Hit News
- Snail Buying The Whole Family Do Not Eat 20 Years
U.S. Report: Hong Kong Building super hard to bear the highest weight of eight global
Hong Kong property prices once again become "world-renowned." Demographia, the U.S. consultancy firm, unveiled the Global Capability Affordability Report yesterday. Hong Kong has been the first in the world to bear the brunt of property prices for eight years in a row. The ratio of property prices to income has deteriorated to 19.4 times from 18.1 times in 2016, meaning It is enough for the entire family not to have to eat for 19.4 years to get enough real estate. The figures are the highest in surveys ever since. This shows that Hong Kong is in the hardest part of history in history. Such a "world number one" is a sad tragedy for Hong Kong people. Sydney, Australia and Vancouver, Canada ranked second and third, respectively, the rates were 12.9 times and 12.6 times.
The ratio of residential property affordability is calculated by dividing the median price of a city by the median household income for the year. The larger the value, the poorer the affordability. Taking Hong Kong's median of 19.4 times means that a family can not afford to eat or drink for 19.4 years to afford a home, which is a tremendous burden.
Refresh homemade record 8 years up 1.4 times
The report shows that as of the third quarter of 2017, the average domestic purchase price of flats in Hong Kong was $ 6,192,000, an increase of 14.2% over the amount of $ 5,422,000 in the same period in 2016. The median annual household income for the same period was $ 309,000, representing a year-on-year increase of 2016 The annual rent of 300,000 HKD only increased by 6.3%. The average residential property price, which is equivalent to the median pre-tax income, therefore pushed up by 18.1 times year-on-year to 19.4 times. That is to say, Hong Kong people's property affordability has deteriorated.
Hong Kong's 19.4-fold record, in addition to becoming the world's most difficult city to afford property prices, further breaks the record high for the record. The old record set against it was also created by Hong Kong. 20In 15 years, the same figure for Hong Kong is 19 times, that is, the latest figure is higher than the old record.
In addition, Hong Kong has been rated as the most difficult city for eight consecutive years. Looking back on the calendar year reports, Hong Kong made its debut on the list in 2010 for the first time. In that year, the average residential building price was 11.4 times the median pre-tax income. At that time, the average residential building price was only $ 2.58 million. Median 225,500 yuan. However, average property prices jumped 1.4 times to 6,192,000 HKD in 8 years. However, the median household income increased by 41.5% to 319,000 HKD during the same period. Household income obviously did not catch up with the increase in property prices.
Away from the runner-up Tokyo Lion City is a mosquito
Compared with other cities in the world, the second and third places in Sydney, Australia and Vancouver, Canada are only 12.9 times and 12.6 times, respectively. Although Hong Kong has been in the same position for two years in a row, Compared to Sydney that year only 12.2 times, Vancouver 11.8 times, in 2017 the data is only slightly higher. As for Singapore and Tokyo, Japan, which is as much as Hong Kong, the figure recorded only 4.8 times in 2017, which is much easier to buy than Hong Kong.
The survey conducted by Demographia covers 293 cities (including 92 top cities with population over 1 million) in 9 countries, including developed cities such as Tokyo, New York, London, Sydney and Singapore. Hong Kong is the only Chinese city in the survey. According to the report, if the price of property is 3 times or below the median income, it is an affordable level; from 3.1 to 4 times as mild as unaffordable; 4.1 to 5 times as unaffordable; and 5.1 times or more as extremely unaffordable .
Based on this calculation, although both Tokyo and Singapore have reached an unmanageable level, the issue of high property prices is only "mosquito and cow" compared to Hong Kong. In 2017, the average property prices in Tokyo and Singapore were only 32.67 million yen (about 2.3 million Hong Kong dollars) and 413.7 thousand Singapore dollars (about 2.67 million Hong Kong dollars). The average property prices in Hong Kong were nearly 1.7 times and 1.5 times higher than those in the two cities.
In the third quarter of 2017, property prices in 28 cities in the survey were extremely "unaffordable". Among them, 13 were in the United States, 6 in the United Kingdom, 5 in Australia, 2 in Canada, 1 in New Zealand and 1 in China .
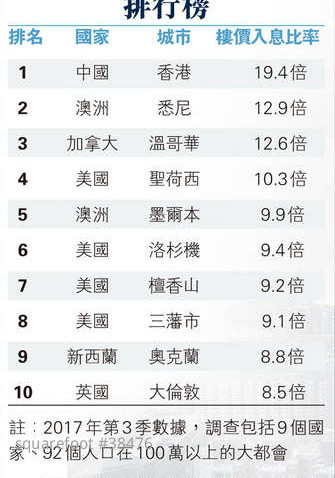
The world's most affordable housing prices city rankings
Ranking the national city property price income ratio
01 Hong Kong, China 19.4 times
02 Sydney, Australia 12.9 times
03 Vancouver, Canada 12.6 times
04 San Jose, United States 10.3 times
05 Melbourne, Australia 9.9 times
06 Los Angeles, the United States 9.4 times
07 Honolulu, United States 9.2 times
08 San Francisco, USA 9.1 times
09 Auckland, New Zealand 8.8 times
10 in Greater London 8.5 times
Note: Figures for the third quarter of 2017, including 9 countries, 92 metropolitan cities with a population of over 1 million
Source: Global Capability Affordability Report
Tabulation: Hong Kong Wen Wei Po Yan Lelan reporter
Like


| Property Type | Price | Ads Period |
|---|---|---|
| For Sale Property | ||
Normal Listing Typical One | HKD:1000 (or Hsemoney:1000) | Valid:90 days |
Golden Top Listing Higher position than Top listing 2-3times better performance | HKD:3000 (or Hsemoney:3000) | Valid:60 days |
| Rental Property | ||
Normal Listing Typical One | HKD:1000 (or Hsemoney:1000) | Valid:80 days |
Golden Top Listing Higher position than Top listing 2-3times better performance | HKD:3000 (or Hsemoney:3000) | Valid:60 days |